blog
MongoDB Monitoring and Trending: Part One

After covering the deployment and configuration of MongoDB in our previous blogposts, we now move on to monitoring basics. Just like MySQL, MongoDB has a broad variety of metrics you can collect and use to monitor the health of your systems. In this blog post we will cover some of the most basic metrics. This will set the scene for the next blog posts where we will dive deeper into their meanings and into storage engine specifics.
Monitoring or Trending?
To manage your databases, you as the DB admin would need good visibility into what is going on. Remember that if a database is not available or not performing, you will be the one under pressure so you want to know what is going on. If there is no monitoring and trending system available, this should be the highest priority. Why? Let’s start by defining ‘trending’ and ‘monitoring’.
A monitoring system is a system that keeps an eye on the database servers and alerts you if something is not right, e.g., a database is offline or the number of connections crossed some defined threshold. In such case, the monitoring system will send a notification in some pre-defined way. Such systems are crucial because, obviously, you want to be the first to know if something’s not right with the database.
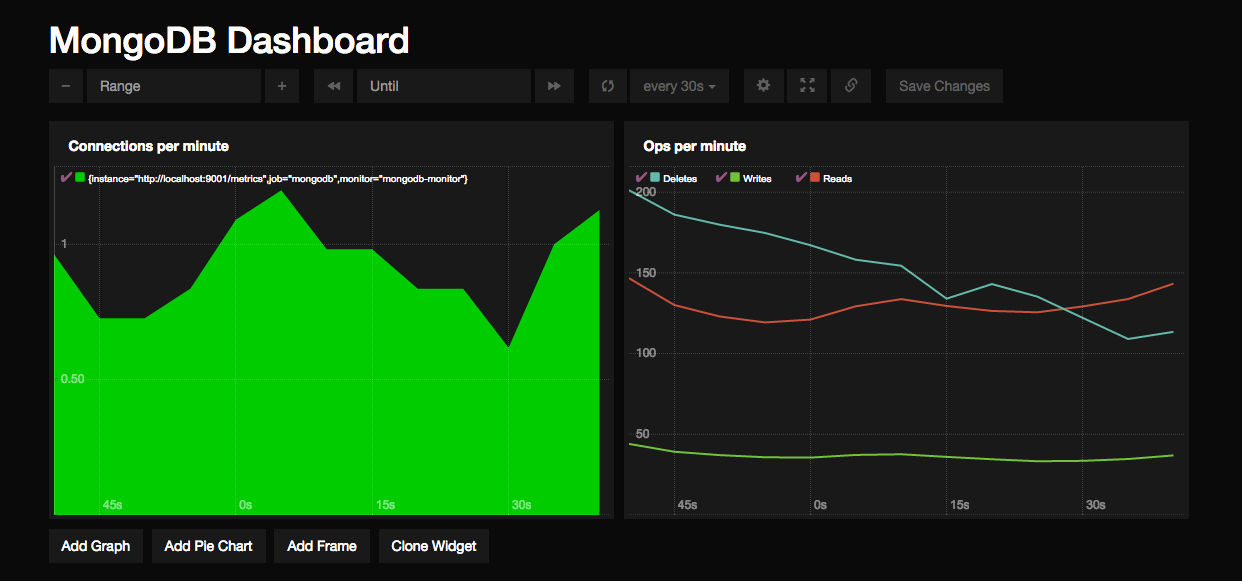
On the other hand, a trending system is your window into the database internals and how they change over time. It will provide you with graphs that show you how those cogwheels are working in the system – the number of connections per second, how many read/write operations the database does on different levels, how many seconds of replication lag do we have, how large was the last journal group commit, and so on.
Data is presented as graphs for better visibility – from graphs, the human mind can easily derive trends and locate anomalies. The trending system also gives you an idea of how things change over time – you need this visibility in both real time and for historical data, as things happen also when people sleep. If you have been on-call in an ops team, it is not unusual for an issue to have disappeared by the time you get paged at 3am, wake up, and log into the system.
Whether you are monitoring or trending, in both cases you will need some sort of input to base your decisions upon. In both cases you will need to collect metrics and analyze them.
Host Metrics
Host metrics are equally important to MongoDB as they are for MySQL. MongoDB is a database system, so it will behave in a large degree the same as MySQL. High load, low IO and low CPU utilization? Your MySQL instinct will be right here as well: there must be some sort of locking issue.
So in terms of host metrics, capture everything you would normally do for any other database:
- CPU usage / load / cpusteal
- Memory usage
- IO
- Network
dbStats
The most basic check you wish to perform on any MongoDB host is whether the service is running and responding. Alongside that check, you can fetch the database statistics to give you the most basic metrics
my_mongodb_0:PRIMARY> use admin
switched to db admin
my_mongodb_0:PRIMARY> db.runCommand( { dbStats : 1 } )
{
    "db" : "admin",
    "collections" : 2,
    "objects" : 2,
    "avgObjSize" : 198,
    "dataSize" : 396,
    "storageSize" : 32768,
    "numExtents" : 0,
    "indexes" : 3,
    "indexSize" : 49152,
    "ok" : 1
}
It is important to switch to the admin database, as otherwise you will capture the stats from the database that you are using. We can spot already here a couple of important stats: the number of collections (like tables), objects, data/storage size and index size. This is a good metric to keep an eye on the growth rate of your MongoDB cluster.
An example of the output from the serverStatus would be:
my_mongodb_0:SECONDARY> db.serverStatus()
{
    "host" : "mongo2.mydomain.com",
    "advisoryHostFQDNs" : [ ],
    "version" : "3.2.7",
    "process" : "mongod",
    "pid" : NumberLong(26939),
    "uptime" : 90345,
    "uptimeMillis" : NumberLong(90345007),
    "uptimeEstimate" : 87717,
    "localTime" : ISODate("2016-06-15T15:53:52.235Z"),
    "connections" : {
        "current" : 5,
        "available" : 51195,
        "totalCreated" : NumberLong(36205)
    },
    "globalLock" : {
        "totalTime" : NumberLong("90345004000"),
        "currentQueue" : {
            "total" : 0,
            "readers" : 0,
            "writers" : 0
        },
        "activeClients" : {
            "total" : 34,
            "readers" : 0,
            "writers" : 0
        }
    },
    "storageEngine" : {
        "name" : "wiredTiger",
        "supportsCommittedReads" : true,
        "persistent" : true
    },
    "wiredTiger" : {
        "uri" : "statistics:",
…
    },
    "ok" : 1
}
As you can see the flexibility of JSON comes in handy here. Unlike MySQL you are not bound by a predefined set of status variables. The wiredTiger object is present here, while when using MongoRocks, we would have an additional rocksdb object. You can find the storage engine in use under the storageEngine object.
That brings us to the subject of querying a specific object within the server status. As MongoDB is all about JSON you can query for one of these objects directly to only receive this object in the result output. Unfortunately this selection only is exclusive, so you need to filter out the ones you don’t want. For example, if we wish to only see the replicaSet information we have to filter out the remainder:
my_mongodb_0:PRIMARY> db.serverStatus({ wiredTiger: 0, asserts: 0, metrics:  0, tcmalloc: 0, locks: 0, opcountersRepl: 0, opcounters: 0, network: 0, globalLock: 0, extra_info: 0, connections: 0, storageEngine: 0})
{
    "host" : "n2",
    "advisoryHostFQDNs" : [ ],
    "version" : "3.2.6-1.0",
    "process" : "mongod",
    "pid" : NumberLong(12122),
    "uptime" : 600,
    "uptimeMillis" : NumberLong(599289),
    "uptimeEstimate" : 576,
    "localTime" : ISODate("2016-06-18T11:13:09.080Z"),
    "repl" : {
        "hosts" : [
            "10.10.32.11:27017",
            "10.10.32.12:27017",
            "10.10.32.13:27017"
        ],
        "setName" : "my_mongodb_0",
        "setVersion" : 1,
        "ismaster" : true,
        "secondary" : false,
        "primary" : "10.10.32.11:27017",
        "me" : "10.10.32.11:27017",
        "electionId" : ObjectId("7fffffff0000000000000001"),
        "rbid" : 1522923277
    },
    "storageEngine" : {
        "name" : "wiredTiger",
        "supportsCommittedReads" : true,
        "persistent" : true
    },
    "ok" : 1
}
Please note that the object in the serverStatus does not contain all information available for replication. So we will have a look at that now.
getReplicationInfo
MongoDB supports Javascript functions to run within the database. This is comparable with the stored procedures in RDBMS-es and gives the DBA a lot of flexibility. The command getReplicationInfo is actually a wrapper function that compiles its output from various sources.
The wrapper function will retrieve information from the oplog to calculate its size and usage. Also it will calculate the time difference between the first entry and last entry in the oplog. On high transaction replicaSets, this will give very useful information: the replication window in your oplog. Suppose one of your replicas goes offline, this will tell you approximately how long it can stay offline without the need of a sync. In MySQL Galera terms: the time before an SST is triggered.
If you are interested in the code, you can have a look at it by calling the function without the brackets:
my_mongodb_0:PRIMARY> db.getReplicationInforeplSetGetStatus
More detailed information about the replicaSet can be retrieved by running the replSetGetStatus command.
my_mongodb_0:PRIMARY> db.runCommand( { replSetGetStatus: 1 } )
{
    "set" : "my_mongodb_0",
    "date" : ISODate("2016-06-18T11:40:34.491Z"),
    "myState" : 1,
    "term" : NumberLong(1),
    "heartbeatIntervalMillis" : NumberLong(2000),
    "members" : [
        {
            "_id" : 0,
            "name" : "10.10.32.11:27017",
            "health" : 1,
            "state" : 1,
            "stateStr" : "PRIMARY",
            "uptime" : 2245,
            "optime" : {
                "ts" : Timestamp(1466247801, 5),
                "t" : NumberLong(1)
            },
            "optimeDate" : ISODate("2016-06-18T11:03:21Z"),
            "electionTime" : Timestamp(1466247800, 1),
            "electionDate" : ISODate("2016-06-18T11:03:20Z"),
            "configVersion" : 1,
            "self" : true
        },
        {
            "_id" : 1,
            "name" : "10.10.32.12:27017",
            "health" : 1,
            "state" : 2,
            "stateStr" : "SECONDARY",
            "uptime" : 2244,
            "optime" : {
                "ts" : Timestamp(1466247801, 5),
                "t" : NumberLong(1)
            },
            "optimeDate" : ISODate("2016-06-18T11:03:21Z"),
            "lastHeartbeat" : ISODate("2016-06-18T11:40:32.992Z"),
            "lastHeartbeatRecv" : ISODate("2016-06-18T11:40:34.382Z"),
            "pingMs" : NumberLong(0),
            "syncingTo" : "10.10.32.11:27017",
            "configVersion" : 1
        },
        {
            "_id" : 2,
            "name" : "10.10.32.13:27017",
            "health" : 1,
            "state" : 2,
            "stateStr" : "SECONDARY",
            "uptime" : 2244,
            "optime" : {
                "ts" : Timestamp(1466247801, 5),
                "t" : NumberLong(1)
            },
            "optimeDate" : ISODate("2016-06-18T11:03:21Z"),
            "lastHeartbeat" : ISODate("2016-06-18T11:40:32.990Z"),
            "lastHeartbeatRecv" : ISODate("2016-06-18T11:40:34.207Z"),
            "pingMs" : NumberLong(0),
            "syncingTo" : "10.10.32.11:27017",
            "configVersion" : 1
        }
    ],
    "ok" : 1
}
This will contain the detailed information per node in the replicaSet, including the health, state, optime and the timestamp of the last heartbeat received. Optime will be a document containing the timestamp of the last entry executed from the oplog. With this you can easily calculate the replication lag per node: subtract this value from the timestamp of the primary and you will have the lag in seconds.
Heartbeats are sent via TCP multicast between each member every two seconds. Heartbeats are used to both determine if other nodes are available/responsive, and take a big part in the new primary election if the primary happens to fail.
Shipping Metrics
Now you know which functions to use to extract certain metrics, but what about storing them in your own monitoring or trending system? For ClusterControl, we have our own internal collector that allows us to run our own queries against MongoDB, but not all systems allow you to define your own queries. In some cases you don’t need to as they feature all statistics out of the box.
For your convenience here is a short overview of some of them.
Statsd
https://github.com/torkelo/mongodb-metrics
This is the most complete MongoDB collector for StatsD. It fetches the most important metrics from MongoDB and ships them to StatsD (and Graphite). Unfortunately it can’t run custom queries or fetch other metrics than the pre-defined ones.
There are a few other projects on Github that ship metrics from MongoDB to StatsD, but these are mostly meant to send data from the collections to StatsD.
OpenTSDB (built in)
https://github.com/OpenTSDB/tcollector
OpenTSDB has a couple of default collectors built in, including a MongoDB collector that imports all available metrics.
Prometheus.io
https://github.com/dcu/mongodb_exporter
A very complete MongoDB exporter for Prometheus. This exporter contains all the major metrics, good description on the metrics and it even does a little bit of interpretation. At the moment of writing, the exporter did not yet support WiredTiger.

Cacti
https://www.percona.com/doc/percona-monitoring-plugins/1.1/cacti/mongodb-templates.html
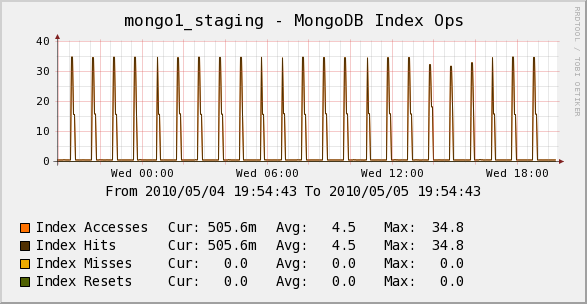
The Percona Monitoring Plugins for MySQL already was an extensive collection of metrics and dashboards, and their Cacti plugins for MongoDB are equally complete for MongoDB. At this moment they don’t yet support WiredTiger specific metrics.

Monitoring and Trending MongoDB in ClusterControl
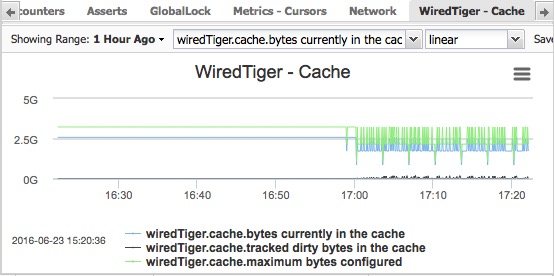
In the recent releases of ClusterControl we have been improving MongoDB monitoring and trending. We are now collecting the most important metrics for replication, journalling and WiredTiger. We can use these metrics to monitor and trend MongoDB, like any other database, in ClusterControl.

Collecting these metrics also allows us to go beyond monitoring and reuse these metrics in our advisors, and give advice to improve certain aspects of the database system. Using the Developer Studio, we allow you to even write your own checks, logic and automation.
Conclusion
We have covered how to collect the metrics, what tools you can use to collect them. However we clearly have not covered the true meaning behind these metrics, or how to combine them with other metrics to gain more insights. That’s what we will do in our next blog post.


